- AdaptWest |
- Current and projected climate data for North America (CMIP3 scenarios)
Current and projected climate data for North America (CMIP3 scenarios)
This dataset was created by Diana Stralberg, Xianli Wang, and Andreas Hamann. It is based on the Parameter Regression of Independent Slopes Model (PRISM) interpolation method for current climate, and the Coupled Model Intercomparison Project phase 3 (CMIP3) database corresponding to the 4th IPCC Assessment Report for future projections.
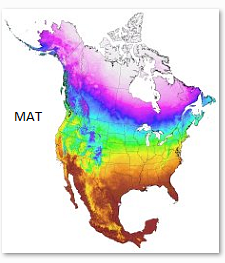
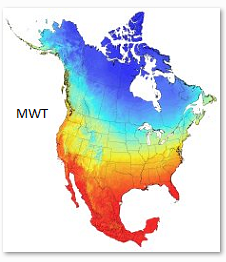
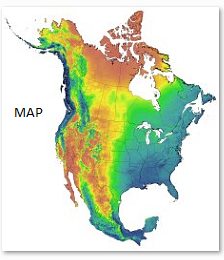
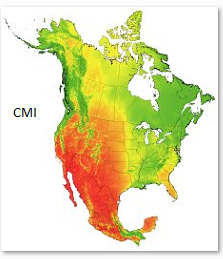
The thumbnails below are images of mean annual temperature (MAT), mean winter temperature with inversions in northern mountain valleys (MWT), mean annual precipitation with leeward rainshadows (MAP), and Hogg's climate moisture index (CMI):
Data coverage and variables
The gridded climate layers downloadable below are in Lambert Conformal Conic projection, covering all of North America. The database is based on a 1km digital elevation model, but sub-sampled at 4km vertical and horizontal intervals for a managable database size. This preserves the full range of climate values (as opposed to a 4km average), and captures elevational gradients, temperature inversions, and rain shadows in the mountainous landscape of western North America.
Two sets of variables are available for download in standard ESRI ASCII format. One comprises 20 biologically relevant variables, including seasonal and annual means, extremes, growing and chilling degree days, snow fall, potential evapotranspiration, and a number of drought indices. The second dataset consists of 36 monthly temperature and precipitation variables.
For downloadable data for individual GCMs, see this page.
Download links for climate data (1km resolution, subsampled at 4km)
|
Average ensembles for all B1 models
|
Average ensembles for all A1B models
|
Average ensembles for all A2 models
|
|---|---|---|
| 2020s: |
2020s: |
2020s: |
1) Validation rank according to Stralberg 2014, Appendix 1 (view PDF).
2) B1: low emission scenario, A1B: moderate emission scenario, A2: high emission scenario.
3) 2020s: average for years 2011-2040, 2050s: 2041-2070, 2080s: 2071-2100.


