
- AdaptWest |
- Climatic dissimilarity for North America
Climatic dissimilarity for North America
This page provides links to data representing climatic dissimilarity for North America that were generated by the AdaptWest project (citation below). Climatic dissimilarity is the most fundamental measure of exposure to climate change in that it represents how different will the future climate at a location be from its current climate. For example, when climate dissimilarity is measured in terms of mean annual temperature, we see the well-known pattern of more rapid warming (amplification of the pace of climate change) at high latitudes. However, shifts in mean annual temperature are only one dimension of climate change. Most climate exposure metrics provided on the AdaptWest site are measured in terms of multivariate climate characteristics, via a principal components analysis (PCA) of 11 biologically-relevant temperature and precipitation variables. Use of PCA results instead of individual climate variables provides a multivariate representation of climate change while retaining the low dimensionality that facilitates development of computationally-complex metrics such as climatic velocity. The loadings on the PCA axes represent to what extent particular variables influence each axis. In the PCA model used here, annual temperature dominates the first PCA axis (PCA1), while annual precipitation dominates PCA2, as shown in Figure 1. Seasonality of temperature and precipitation dominate PCA3 & PCA4, respectively.

Figure 1. Geographic distribution of values of (a) first and (b) second axes of a PCA of 11 bioclimatic variables for 1981-2010 climate normals.
The maps in Figure 2 (below) represent climatic dissimilarity (the pace of
climate change) in multivariate climate space (PCA1 and PCA2). The pattern
of rapid warming at high latitudes is evident. Rapid change in alpine areas
of the Rocky Mountains and Pacific Coast is caused by changes in both
temperature and precipitation.
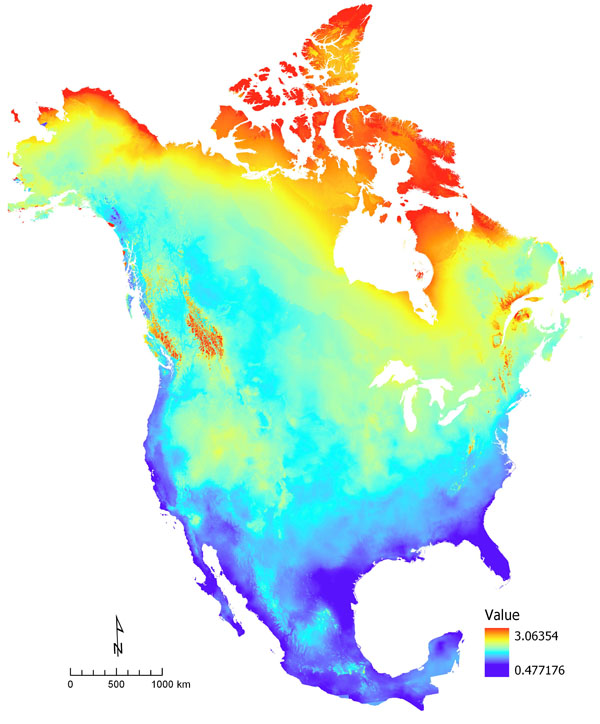
Figure 2. Dissimilarity in multivariate climate space (PCA1 and PCA2) between current (1981-2010) climate normals and future (2071-2100) projected climate under RCP 8.5.
Climate dissimilarity, although the most basic climate exposure metric, has complex aspects. Recent studies have proposed that in addition to the absolute magnitude of dissimilarity between current and future climates at a location, it is also relevant to understand how that dissimilarity compares to the year-to-year (interannual) variation in climate at that location in the recent past. If the biota in an area was adapted to large interannual climate variations, it might be less sensitive to future climate change.The map in Figure 3 below shows data on relative climatic dissimilarity developed by Mahony et al. (2017) from annual temperature and precipitation data. Relative dissimilarity does not show the strong pattern of increasing values at high latitudes that was evident for absolute dissimilarity (Figure 2). Montane areas experience high interannual climate variation and thus have lower relative dissimilarity. Conversely, because areas of the southeastern US now experience low climate variability between years, they will in the future experience relatively low absolute dissimilarity but high relative dissimilarity. Absolute and relative dissimilarity describe different aspects of climate exposure and should be seen as complementary.
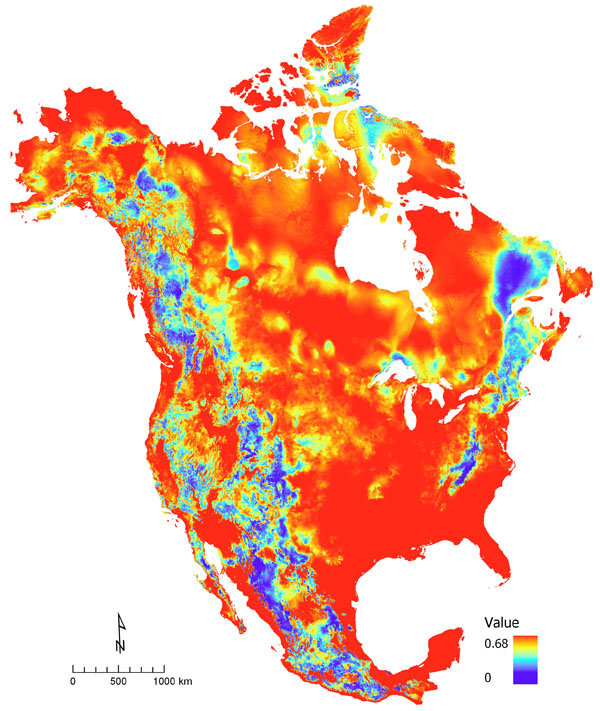
| Figure 3. Relative dissimilarity in multivariate climate space between 1971-2000 climate normals and future (2071-2100) projected climate under RCP 8.5, as developed by Mahony et al. (2017; see paper for details of methods). |
Data
The raster data layers downloadable below are in Lambert Azimuthal Equal Area projection, at 1km resolution, and covering North America. Values represent distance in multivariate climate space (on the PCA1 and PCA2 axes) between current (1981-2010) and future (either 2041-2070 ("2055") or 2071-2100 ("2085")). Ensemble data are based on mean projections from 15 CMIP5 models (CanESM2, ACCESS1.0, IPSL-CM5A-MR, MIROC5, MPI-ESM-LR, CCSM4, HadGEM2-ES, CNRM-CM5, CSIRO Mk 3.6, GFDL-CM3, INM-CM4, MRI-CGCM3, MIROC-ESM, CESM1-CAM5, GISS-E2R) that were chosen to represent all major clusters of similar AOGCMs (Knutti et al 2013, Geophys Res Let 40: 1–6, doi:10.1002/grl.50256). Projections from 8 of these 15 GCMs were also used to generate dissimilarity values based on individual GCM projections. All archives have been compressed with the 7-zip utilty. To extract the data, use the 7-zip software, which is freely available for Windows (link) as well as Mac and Linux systems (link). Use of 7-zip in place of the standard zip format allows better compression, lower storage costs, and shorter download times.
|
Data files
|
Download
|
|---|---|
|
Absolute climatic dissimilarity, 7-zip format (2.8 GB)
|
Zipfile:
|
|
PCA values used in calculations, 7-zip format (10.4 GB)
|
Zipfile:
|
|
Relative climatic dissimilarity developed by Mahony et al. (2017).
|
Link:
|
|
Selected rasters as Databasin map layers
|
|
| Absolute climatic dissimilarity (RCP 8.5, 2050s) | Map layer |
| Absolute climatic dissimilarity (RCP 8.5, 2080s) | Map layer |
Description of data layers
Format: GeoTIFF, signed single precision
Datum WGS 1984
Linear Unit Meter
Angular Unit Degree
False Easting 0
False Northing 0
Central Meridian -100
Latitude of Origin 45
Cell Size 1000
Carroll, C. 2018. Climatic dissimilarity data for North America at 1 km resolution. https://doi.org/10.5281/zenodo.1473825. Available online at https://adaptwest.databasin.org/pages/climatic-dissimilarity.