
- AdaptWest |
- Current and projected climate data for North America (CMIP5 scenarios)
Current and projected climate data for North America (CMIP5 scenarios)
Please cite the datasets below as:
AdaptWest Project. 2015. Gridded current and projected climate data for North America at 1km resolution, interpolated using the ClimateNA v5.10 software (T. Wang et al., 2015). Available at adaptwest.databasin.org.
For interpolated data produced using the older CMIP3 projections, see this link.
For further
information and citation refer to:
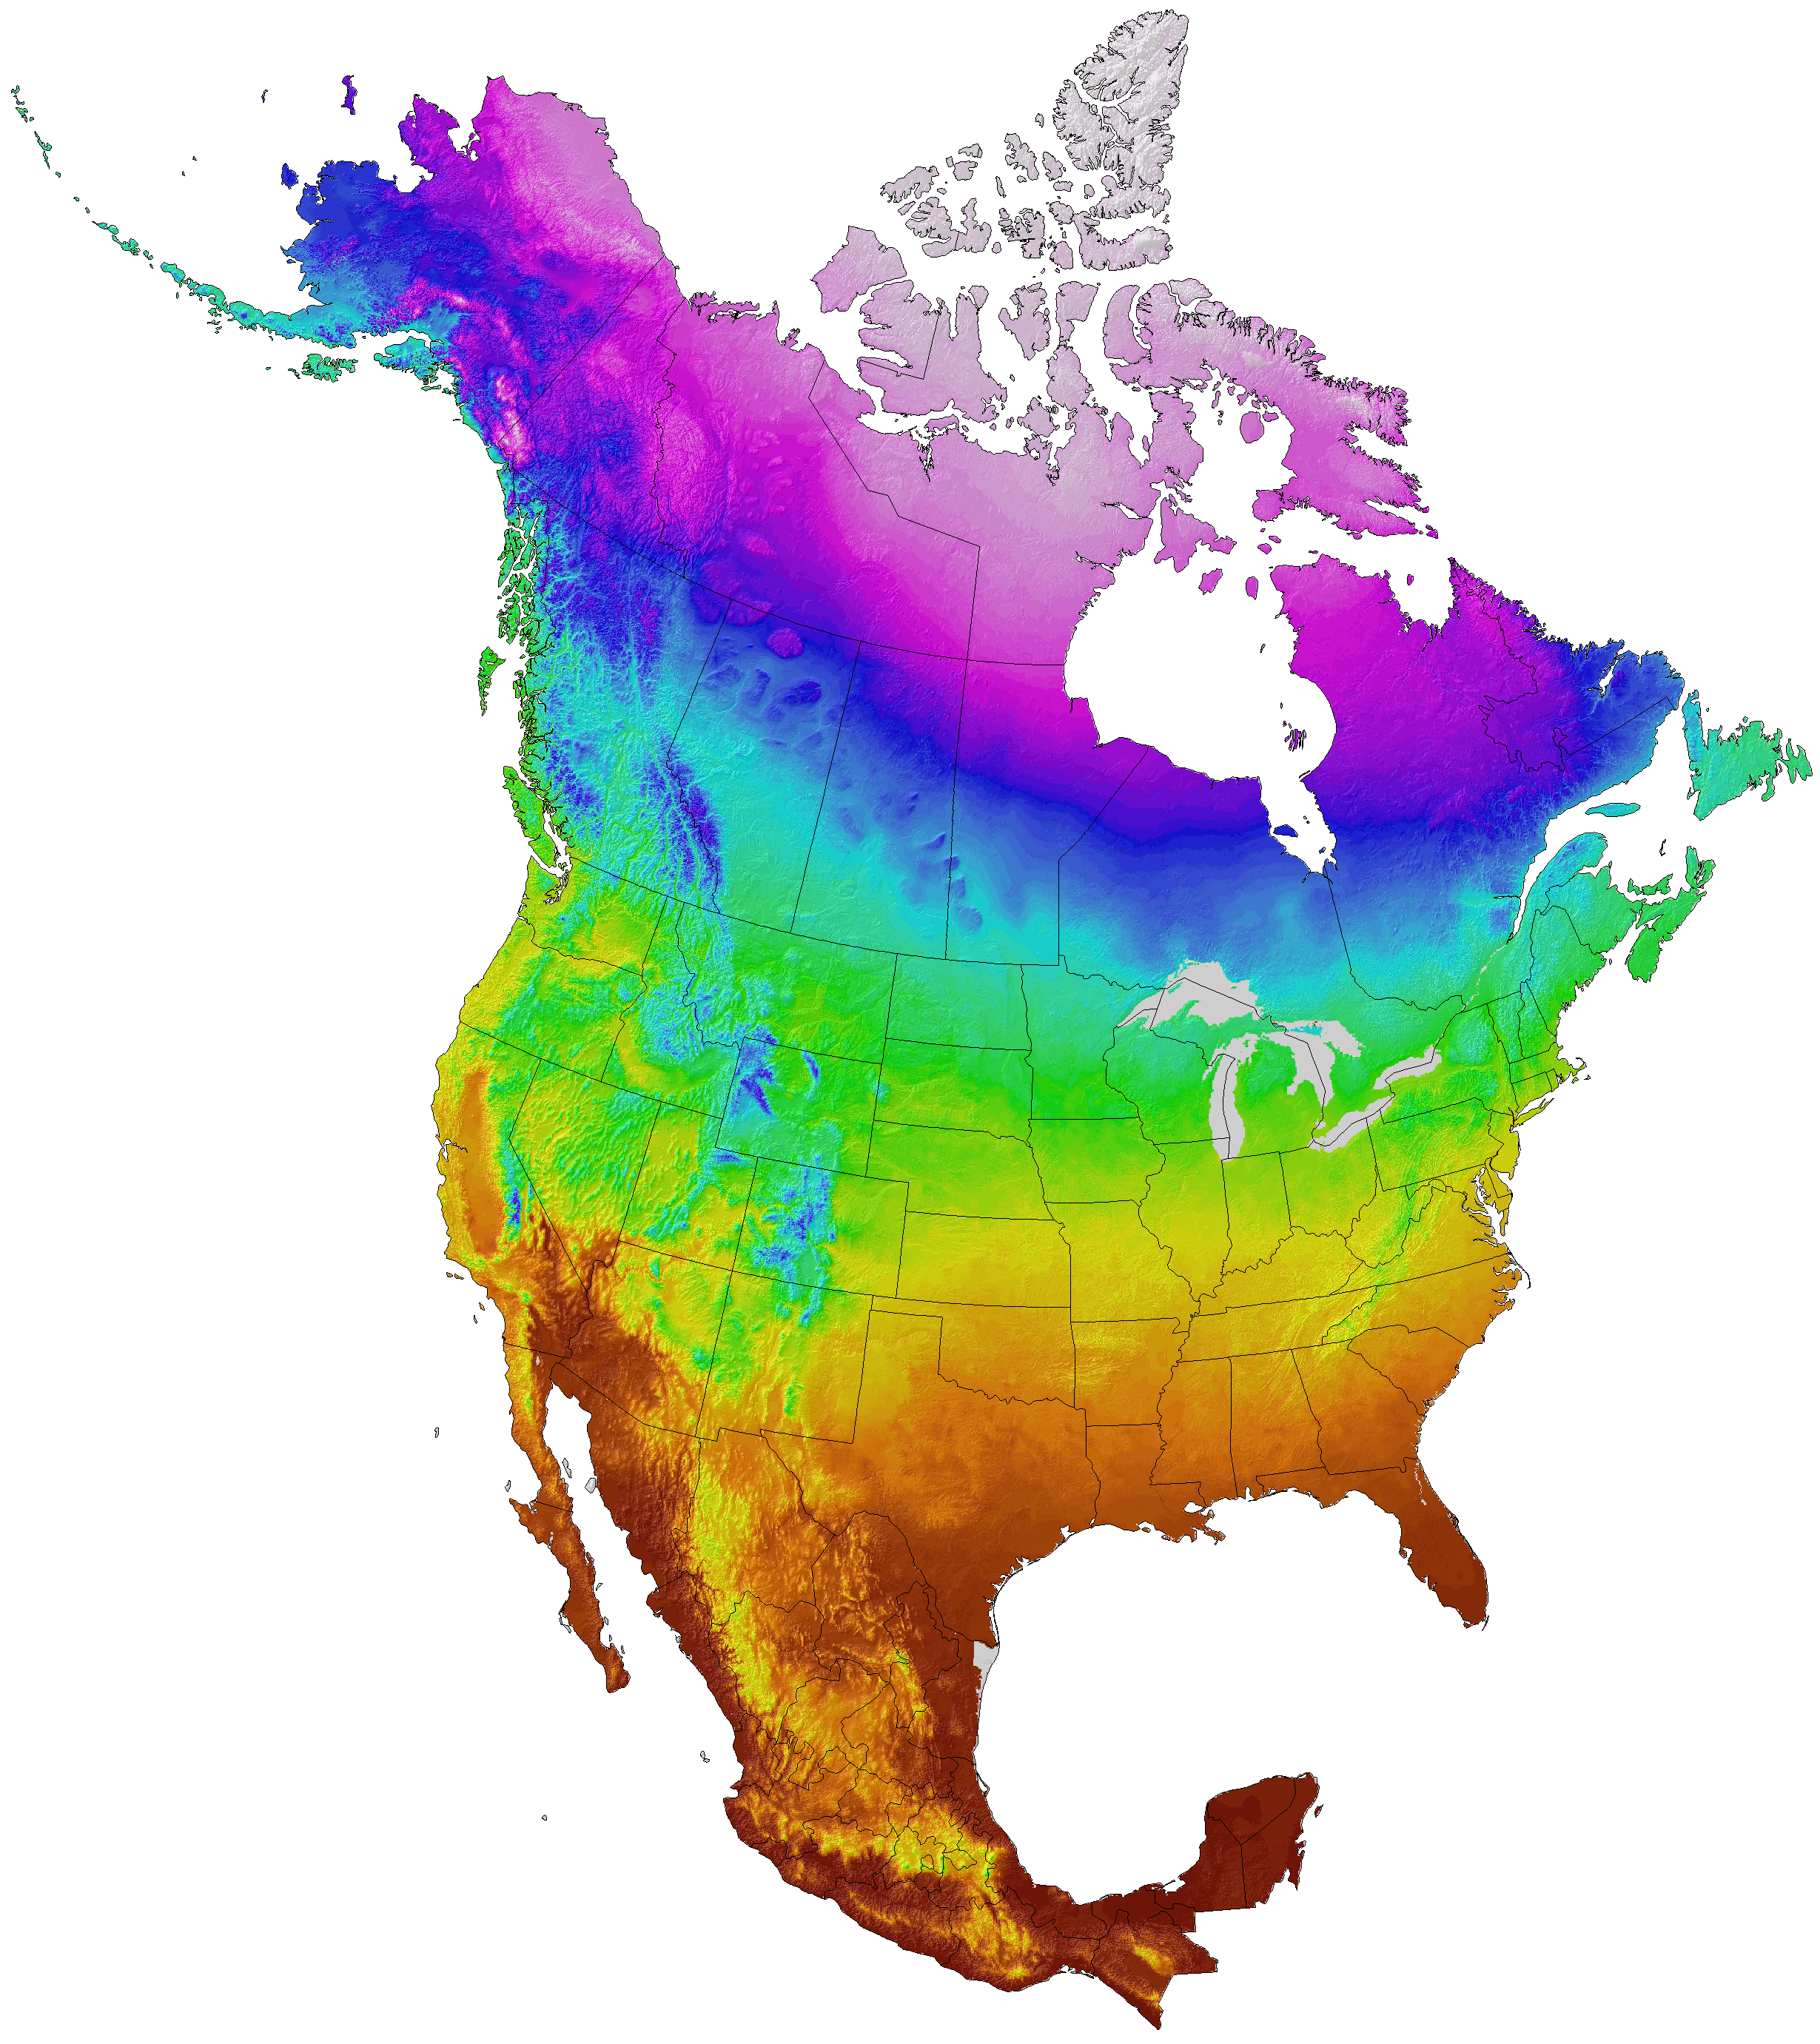
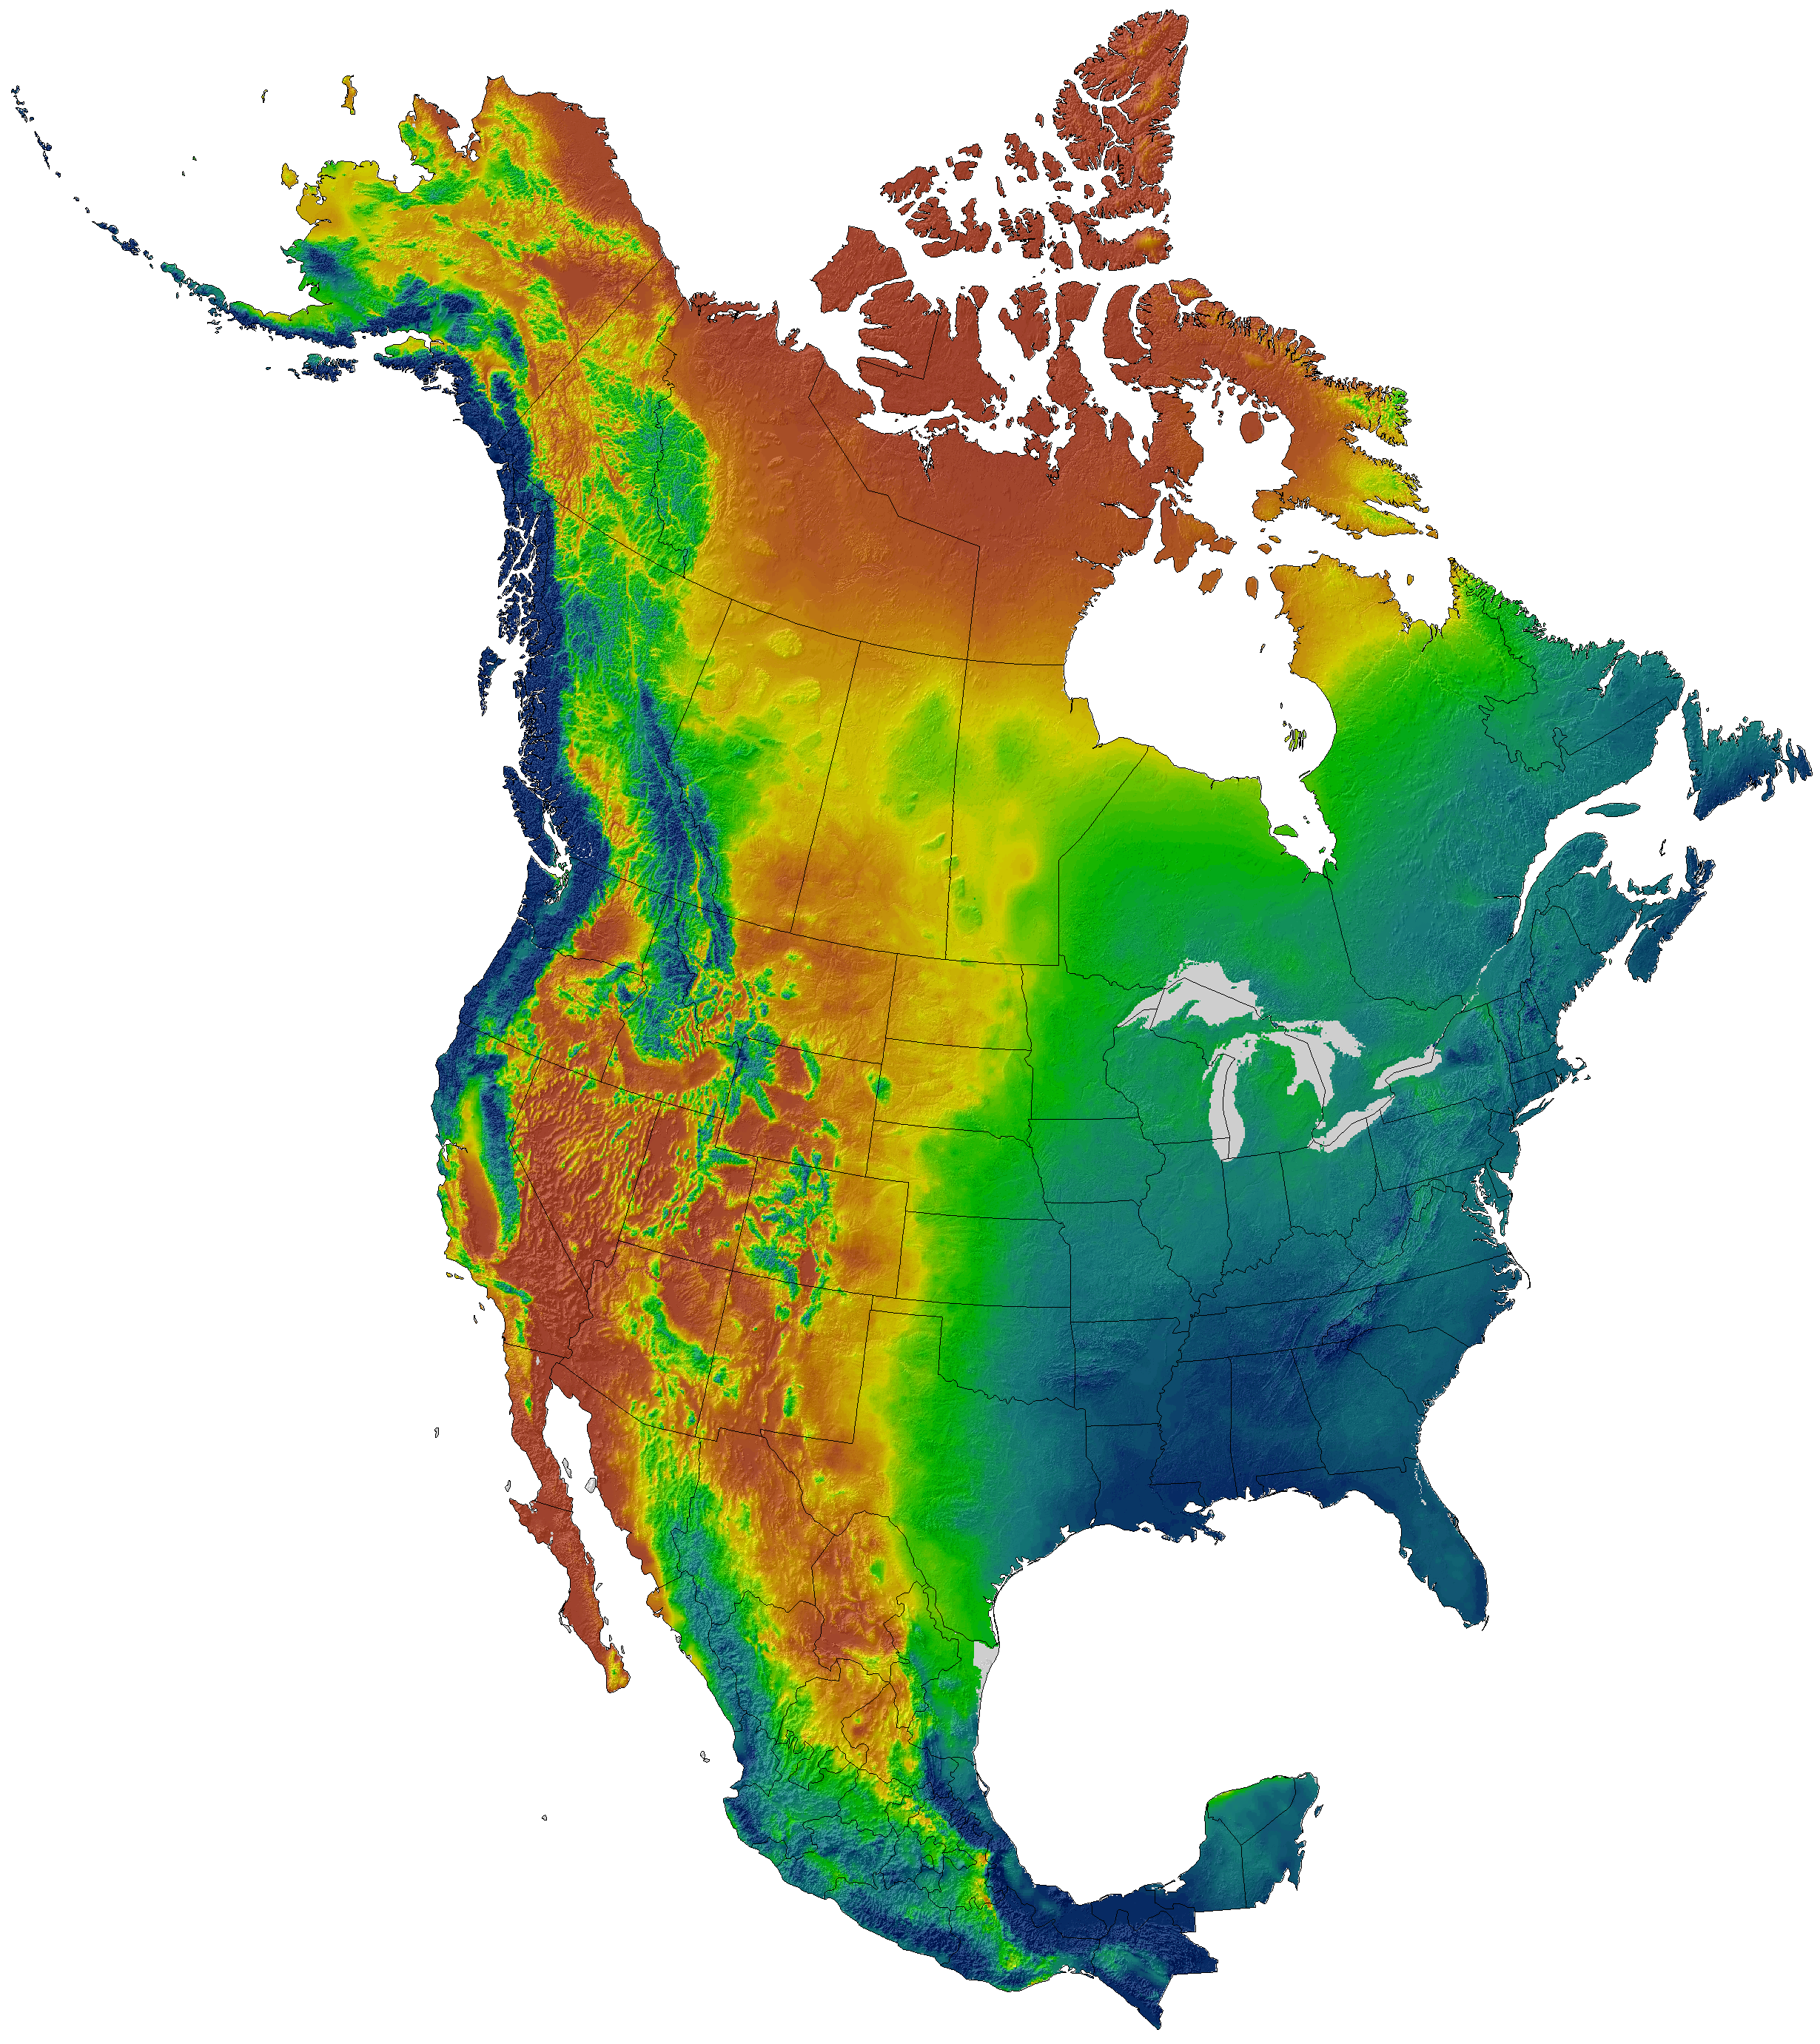
Click on the thumbnails below to see high resolution images
of mean annual temperature (MAT), mean winter temperature with
inversions in northern mountain valleys (MWT), and mean annual
preciptiation with leeward rainshadows (MAP).

Data coverage and variables
The gridded climate layers downloadable below are in Lambert Conformal Conic projection, at 1km resolution, and covering North America. The database consists of 23 million grid cells and is designed to capture climate gradients, temperature inversions, and rain shadows in the landscape of North America.
There are two data formats available.
ASCII (.asc) files can be transformed into ESRI grids, a
native format of ArcGIS software, but
are also compatible with many other GIS applications. NetCDF (.nc)
files, a non-proprietary format, are compatible with most GIS
applications.
Two sets of variables are available for download. One consists of 27 biologically relevant variables, including seasonal and annual means, extremes, growing and chilling degree days, snow fall, potential evapotranspiration, and a number of drought indices. The second dataset consists of 48 monthly temperature and precipitation variables.
All archives have been compressed with the 7-zip utilty. To extract the data, use the 7-zip software, which is freely available for Windows (link) as well as Mac and Linux systems (link). Use of 7-zip in place of the standard zip format allows better compression, lower storage costs, and shorter download times.
(Please note that there is a typo (an extra hyphen) in the proj4string for the NetCDF files. The value "lon_0=--95.0" should be changed to "lon_0=-95.0").
Model selection
Selecting scenarios for climate change impact and adaptation
research is a complex task. We selected eight individual models to
represent all major clusters of similar AOGCMs (Knutti
et al 2013) with high
validation statistics.
To further whittle the number of AOGCMs under consideration down,
researchers often select "worst case", "best case", and "median"
climate change projections. However, what constitutes a worst case or
best case scenario, differs by region and by the climate variable of
interest.
The table below may help with scenario selection for states and
provinces within western North America. We also provide ensemble
scenarios for download above, but they may have unrealistic
combinations of individual climate variables.
Mean annual temperature change for states
and provinces of North America projected for the 2050s under the RCP4.5
scenario.
States and provinces are alphabetically sorted from left to
right, AOGCMs are sorted by magnitude of projection for North America
from top to bottom.

Mean annual precipitation change for states
and provinces of North America projected for the 2050s under the RCP4.5
scenario.
States and provinces are alphabetically sorted from left to
right, AOGCMs are sorted by magnitude of projection for North America
from top to bottom. 
Download links for climate data (1km resolution)
|
Reference files: Elevation, ID
|
Meta data: Projection, Variables
|
|---|---|
| netCDF ASCII | Readme ESRI |
| Climate
normals |
27 Bioclimatic variables | 48 Monthly variables | ||
| 1961-1990
period |
netCDF ASCII | netCDF ASCII | ||
| 1981-2010
period |
netCDF ASCII | netCDF ASCII | ||
|
Projection
|
Emission scenario2 |
Future period3
|
27 Bioclimatic variables
|
48 Monthly variables
|
|---|---|---|---|---|
| AOGCM ensemble projections | ||||
| Ensemble of
15 CMIP5 AOGCMs1 |
RCP4.5 |
2020s | netCDF ASCII | netCDF ASCII |
| RCP4.5 |
2050s | netCDF ASCII | netCDF ASCII | |
| RCP4.5 |
2080s | netCDF ASCII | netCDF ASCII | |
| RCP8.5 |
2020s | netCDF ASCII | netCDF ASCII | |
| RCP8.5 |
2050s | netCDF ASCII | netCDF ASCII | |
| RCP8.5 |
2080s | netCDF ASCII | netCDF ASCII | |
| Projections from individual AOGCMs | ||||
| CCSM4 |
RCP4.5 | 2020s |
netCDF ASCII | netCDF ASCII |
| RCP4.5 |
2050s | netCDF ASCII | netCDF ASCII | |
| RCP4.5 | 2080s | netCDF ASCII | netCDF ASCII | |
| RCP8.5 | 2020s | netCDF ASCII | netCDF ASCII | |
| RCP8.5 | 2050s | netCDF ASCII | netCDF ASCII | |
| RCP8.5 | 2080s | netCDF ASCII | netCDF ASCII | |
| CNRM-CM5 |
RCP4.5 | 2020s | netCDF ASCII | netCDF ASCII |
| RCP4.5 | 2050s | netCDF ASCII | netCDF ASCII | |
| RCP4.5 | 2080s | netCDF ASCII | netCDF ASCII | |
| RCP8.5 | 2020s | netCDF ASCII | netCDF ASCII | |
| RCP8.5 | 2050s | netCDF ASCII | netCDF ASCII | |
| RCP8.5 | 2080s | netCDF ASCII | netCDF ASCII | |
| CanESM2 |
RCP4.5 | 2020s | netCDF ASCII | netCDF ASCII |
| RCP4.5 | 2050s | netCDF ASCII | netCDF ASCII | |
| RCP4.5 | 2080s | netCDF ASCII | netCDF ASCII | |
| RCP8.5 | 2020s | netCDF ASCII | netCDF ASCII | |
| RCP8.5 | 2050s | netCDF ASCII | netCDF ASCII | |
| RCP8.5 | 2080s | netCDF ASCII | netCDF ASCII | |
| GFDL-CM3 |
RCP4.5 | 2020s | netCDF ASCII | netCDF ASCII |
| RCP4.5 | 2050s | netCDF ASCII | netCDF ASCII | |
| RCP4.5 | 2080s | netCDF ASCII | netCDF ASCII | |
| RCP8.5 | 2020s | netCDF ASCII | netCDF ASCII | |
| RCP8.5 | 2050s | netCDF ASCII | netCDF ASCII | |
| RCP8.5 | 2080s | netCDF ASCII | netCDF ASCII | |
| HadGEM2-ES [NOTE April 20, 2020: A minor downscaling |
RCP4.5 | 2020s | netCDF ASCII | netCDF ASCII |
| error was found in a subset of the monthly and seasonal |
RCP4.5 | 2050s | netCDF ASCII | netCDF ASCII |
| variables for HadGEM2-ES, and we have disabled download |
RCP4.5 | 2080s | netCDF ASCII | netCDF ASCII |
| of this GCM until this has been corrected.] |
RCP8.5 | 2020s | netCDF ASCII | netCDF ASCII |
| RCP8.5 | 2050s | netCDF ASCII | netCDF ASCII | |
| RCP8.5 | 2080s | netCDF ASCII | netCDF ASCII | |
| INM-CM4 |
RCP4.5 | 2020s | netCDF ASCII | netCDF ASCII |
| RCP4.5 | 2050s | netCDF ASCII | netCDF ASCII | |
| RCP4.5 | 2080s | netCDF ASCII | netCDF ASCII | |
| RCP8.5 | 2020s | netCDF ASCII | netCDF ASCII | |
| RCP8.5 | 2050s | netCDF ASCII | netCDF ASCII | |
| RCP8.5 | 2080s | netCDF ASCII | netCDF ASCII | |
| IPSL-CM5A-MR |
RCP4.5 | 2020s | netCDF ASCII | netCDF ASCII |
| RCP4.5 | 2050s | netCDF ASCII | netCDF ASCII | |
| RCP4.5 | 2080s | netCDF ASCII | netCDF ASCII | |
| RCP8.5 | 2020s | netCDF ASCII | netCDF ASCII | |
| RCP8.5 | 2050s | netCDF ASCII | netCDF ASCII | |
| RCP8.5 | 2080s | netCDF ASCII | netCDF ASCII | |
| MPI-ESM-LR |
RCP4.5 | 2020s | netCDF ASCII | netCDF ASCII |
| RCP4.5 | 2050s | netCDF ASCII | netCDF ASCII | |
| RCP4.5 | 2080s | netCDF ASCII | netCDF ASCII | |
| RCP8.5 | 2020s | netCDF ASCII | netCDF ASCII | |
| RCP8.5 | 2050s | netCDF ASCII | netCDF ASCII | |
| RCP8.5 | 2080s | netCDF ASCII | netCDF ASCII | |
Footnotes:
1. The ensemble was composed of the following AOGCMs: ACCESS1-0,CCSM4,CESM1-CAM5,CNRM-CM5,CSIRO-Mk3-6-0,CanESM2,GFDL-CM3,GISS-E2R,HadGEM2-ES,INM-CM4,IPSL-CM5A-MR,MIROC-ESM,MIROC5,MPI-ESM-LR,MRI-CGCM3.
2. RCP4.5: low emissions scenario (more info), RCP8.5: high emissions scenario (more info).
3. 2020s: average for years 2011-2040, 2050s: 2041-2070, 2080s: 2071-2100.