
- AdaptWest |
- Environmental diversity data for North America
Environmental diversity data for North America
This page provides links to several datasets that were generated for and presented in Carroll et al. 2017 "Scale-dependent complementarity of climatic velocity and environmental diversity for identifying priority areas for conservation under climate change" (full citation below). These datasets represent different types of environmental diversity metrics than can be used to help identify climate change refugia. Some approaches to identifying areas that will be refuges for biodiversity under climate change are based on predicting future climate. Other approaches use only information on the current environment, finding areas where there are steep elevation gradients or other factors which might allow species to find climate refuges nearby. We compared these approaches across North America, and showed how planners can combine different types of information to identify conservation priorities that will be effective despite the variation between priorities identified by the different approaches.
How do the various climate resilience related metrics differ?
Considering how the different metrics vary with elevation provides one method of characterizing their contrasts and commonlaities. The environmental diversity metrics that we considered fell into three groups in terms of their correlation with elevation. Priorities developed from the two topographic diversity metrics increased focus on high-elevation areas (Figure 1 below). In contrast, priorities derived from categorical landscape units rather than continuous variables distributed conservation priorities more broadly across elevation zones. Land facet and ecotypic diversity were similar in this effect, despite being based on different landscape classifications. This contrast is partly due to both the incorporation of additional non-topographic inputs (edaphic, climatic, and landcover data) into the categorical metrics. Additionally, the ecologically-informed class boundaries used to categorize the data, and the different index by which diversity was measured for categorical variables, contributed to shifting high diversity areas towards lower elevations. For example, low- to mid-elevation areas with high ecotypic diversity might include an ecotone originating from precipitation thresholds governing the shift from forest to grassland ecosystems. However, the ability of such landscape classifications to predict refugia depends in part on whether these thresholds retain their relevance to biota under future climates. Both current climatic diversity and backward climatic velocity showed an intermediate relationship with elevation when compared to the two previous groups. These metrics are influenced by topography (due to use of topographic data in the statistical downscaling process) but also by broad-scale factors such as prevailing circulation patterns, coastal proximity and orographic effectiveness of the terrain. Peak values of climatic diversity may, for example, occur in rain shadow areas on the leeward side of mountain tops.

How can planners compensate for and address the contrasts between these metrics?
To address uncertainty created by this variation, planners can combine priorities identified by alternative metrics at a single resolution and downweight areas of high variation between metrics. Figure 2 (below) shows the result of such a multi-objective analysis using the conservation planning software Zonation. Alternately, coarse-resolution velocity metrics can be combined with fine-resolution diversity metrics in order to leverage the respective strengths of the two groups of metrics as tools for identification of potential macro- and micro-refugia that in combination maximize both transient and long-term resilience to climate change. Figures 3 and 4 (below) illustrate the conceptual basis for such a multi-scale strategy. In our view, planners should compare and integrate approaches that span a range of model complexity and spatial scale to match the range of ecological and physical processes influencing persistence of biodiversity and identify a conservation network resilient to threats operating at multiple scales.

Figure 2. Conservation priority ranking for North America based on a multi-objective Zonation solution capturing areas of high importance based on six diversity and velocity metrics.

Figure 3. The bivariate distribution of elevational diversity and backward climatic velocity values for 1 km2 cells (pixels) in North America, indicating their relative value as macro- (y-axis) and microrefugia (x-axis).
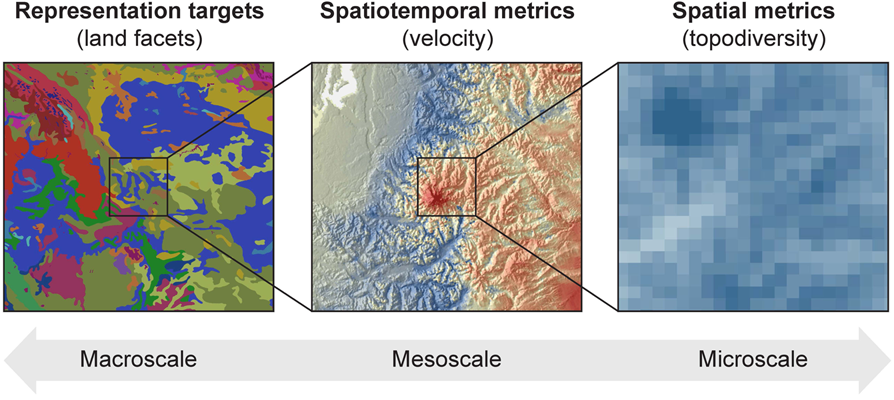
Figure 4. Conceptual diagram of a multi-scale prioritization strategy for refugia identification and landscape-level adaptation planning. A network of priority conservation areas would be designed to capture high-diversity microrefugia within areas of low climatic velocity, distributed across landscape types.
Data
Each archive below contains a compressed raster in the ASCII (.asc) format that can be imported into ArcGIS or other GIS applications. The raster data are in Lambert Azimuthal Equal Area projection, at 1km resolution, and covering North America. Moving-window extent for the diversity metrics was 27 by 27 km (see Carroll et al. 2017 for more All archives have been compressed with the 7-zip utilty. To extract the data, use the 7-zip software, which is freely available for Windows as well as Mac and Linux systems (link). Use of 7-zip in place of the standard zip format allows better compression, lower storage costs, and shorter download times.
This
data has been prepared for
the AdaptWest project and its development was funded by the Wilburforce
Foundation.
| Figure 1. Contrasts between diversity and velocity metrics in their relationship with elevation zones: a) generalized additive model of relationship between metrics and elevation across North America, b) conceptual figure indicating elevational zones showing high values of the various metrics. |
|
Data files
|
Download
|
|---|---|
|
Elevational diversity
|
Zipfile:
|
|
Heat load index (HLI) diversity
|
Zipfile:
|
|
Current climatic diversity
|
Zipfile:
|
| Ecotypic diversity | Zipfile:
|
| Land facet diversity | Zipfile:
|
| Refugia index derived from backward climatic velocity | Zipfile:
|
| Climate zones (n=90) | Zipfile:
|
| Climate types (n=495) | Zipfile:
|