
- AdaptWest |
- Wildland conservation values of the contiguous U.S.
Wildland conservation values of the contiguous U.S.
This page provides links to a dataset that was generated for and presented in Belote et al. 2017 (citation below). They used data on: (1) ecological integrity (Theobald 2013), (2) the connectivity value for land to serve as a corridor between protected areas (Belote et al. 2016), (3) how well ecosystems are already represented within protected areas (Aycrigg et al. 2013), and (4) whether a location is rich in endemic species that are not well protected in conservation reserves (Jenkins et al. 2015). Areas that rate highly in these combined values should receive greater consideration and priority for some form of conservation protection in a national network of ecological reserves per recent recommendations of Aycrigg et al. (2016). Adding lands with these qualities may be an important strategy to improve the resilience of conservation reserve systems for the future (Belote et al. 2017).These datasets represent composite wildland conservation value for the conterminous United States. Data were normalized for each value to range from 0 (lowest priority) to 1 (highest priority) and summed them to produce a map of wildland conservation values. These data can be used to inform conservation planning at regional scales. Data are available as a geotiff file or in a map package that can be unpacked using ArcCatalog.
This dataset has been prepared by scientists at The Wilderness Society using data from the AdaptWest project and others sources.
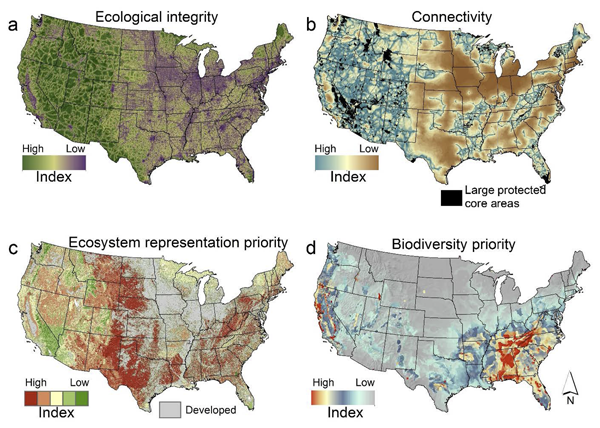
Figure 1.
Indices of conservation values used to prioritize completing the system of
protected areas: ecological integrity (a), connectivity (b), ecosystem
representation priority (c), and biodiversity priority (d).
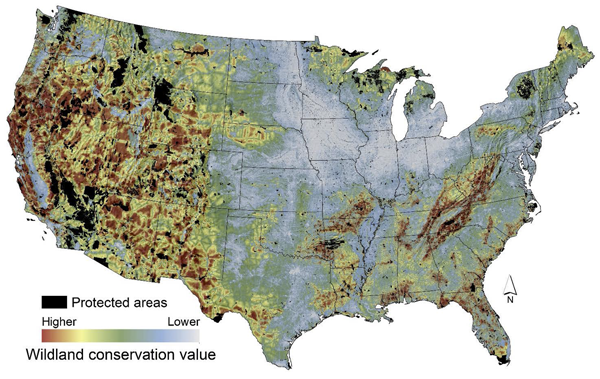
Figure 2.
Composite map of wildland conservation value based on an overlay sum of
qualities in Figure 1. Lands within existing protected areas (GAP status 1 and
2) are shown here as black (i.e., not a priority, because they are already
highly protected).
Belote, R. T., M. S. Dietz, B. H. McRae, D. M. Theobald, M. L. McClure, G. H. Irwin, P. S. McKinley, J. A. Gage, and G. H. Aplet. 2016. Identifying corridors among large protected areas in the United States. PLoS ONE 11:e0154223.
Jenkins, C. N., K. S. Van Houtan, S. L. Pimm, and J. O. Sexton. 2015. US protected lands mismatch biodiversity priorities. Proceedings of the National Academy of Sciences of the United States of America 112:5081–5086.
Theobald, D. M. 2013. A general model to quantify ecological integrity for landscape assessments and US application. Landscape Ecology 28:1859–1874.
|
Data files
|
Download links
|
|---|---|
|
Documentation (pdf)
|
|
|
Composite value raster in geotiff format (zipfile)
|
|
|
ArcGIS map package containing composite value raster (mpk)
|
|
|
Table of land cover hierarchy and ecosystem representation value (zipfile)
|
|